Welcome back. It has been a while.
Some news
First, let me address the elephant in the room: Last week, ABC News fired the entirety of the (small) remaining staff at FiveThirtyEight (or 538, as they rebranded it in July 2023), including me. Needless to say this is a huge loss for journalism. The 13 people I worked with were some of the smartest, kindest and most talented journalists I have ever met. Moreover, no newsroom has such a dedication to factfulness in political writing, nor in using complex tools for advanced news analysis while meeting readers where they are.
The void left by 538, frankly, is chasmic. Not only will we not produce new content at the intersection of news and statistical analysis, but ABC News also took down the website powering our archive of interactive journalism, preventing most of us from accessing a big chunk of our historical body of work. 538, at least for now, is dead. You can read individual articles by searching for them on Google, or via the various web archives online, but otherwise the work is simply gone. Yes, this even includes the polling averages and election forecasts staff had created going back to 2014. It is an immense loss. Public data about the public is borderline sacred, and should remain public. (For now the 538 Github page is still up, but who knows for how much longer.)
I have many thoughts and some news to share on this, but the most immediate note is that I am now a free agent, able to write posts and post charts and make memes and talk with you all transparently about data and modeling. It also means that I’m looking for a job/something new to do. Some things are in the works, but more on that in a moment.
Being laid off has left me with more free time to make fun charts, so I thought it’d be good to start a regular-ish feature here where I make one chart each ~Friday that touches on notable news from the previous week, for a few reasons: First is that it gives readers proof of life at this newsletter/incentivizes me to keep a regular cadence of digesting news and offering takes so I don’t lose my journalism/content subroutine. Regardless of what I do next, I want to be able to return to a dialogue with my readers and get back to having our nice chats about data-driven news and esp. political analysis.
The second reason is that I have felt some of my chart-making skills atrophy in the year and a half I was at 538, when I had to focus a lot more time on management and dealing with higher-ups than on coding, writing and generally just doing data journalism. So, somewhat selfishly, the weekly feature also gives me a chance to beef up my visual skills again. Maybe I’ll also get to try some new charting tools.
This week’s chart
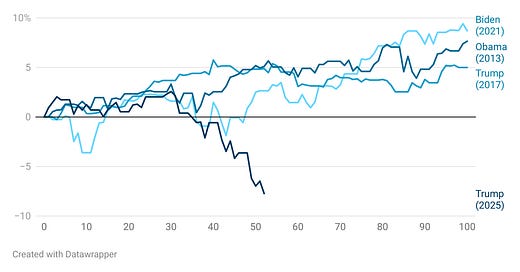
And that brings us to this week’s chart. I do not intend for this to be a long feature, just a quick explanation about an easy-to-digest chart. By far the most notable headline this week is about the plunging value of the U.S. stock market (The New York Times, for example, has run a chart of the NASDAQ in correction territory (a 10%+ drop from all-time-highs) on their homepage for a couple days in a row). So let’s look at stock market returns during the early days of Trump’s presidency and compare them to returns at the start of previous presidential terms:
Note that, at the time of writing, the market looks to be about 150 basis points (or 1.5%) up from the Trump (2025) low point on the chart, but I do not include that value as it is not the close value for the day (I do not have a time machine).
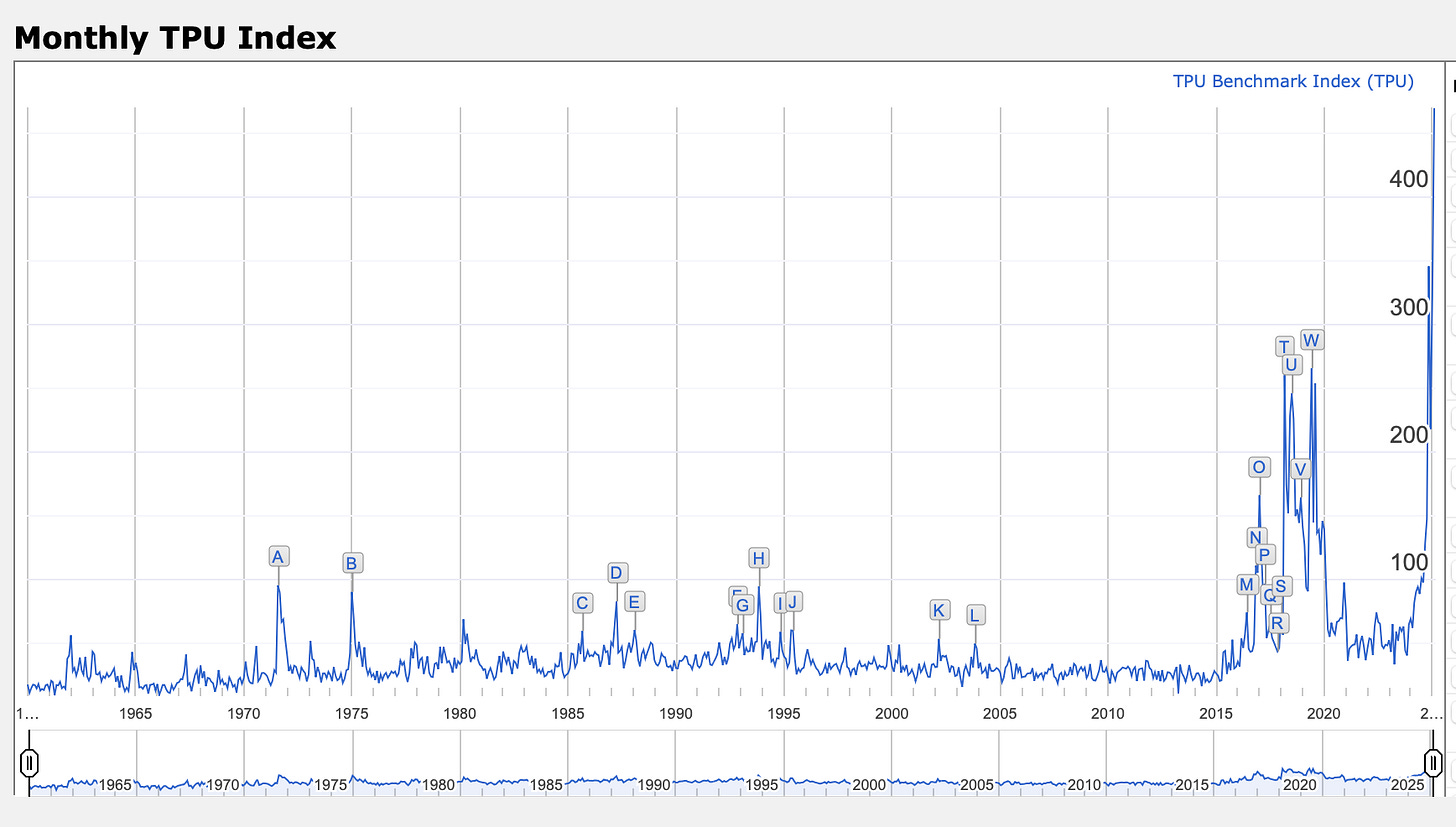
U.S. stocks have also underperformed global trends year-to-date. There is something about America in this moment that is causing stocks to underperform. Not-so-coincidentally, uncertainty about economic and trade policy is also at an all-time-high:
Uncertainty is bad for markets (unless you’re trading vol); Capital dries up as traders don’t know which way the wind will blow, and people pull out their money fearing a broader collapse. That’s how you get a stock chart like the one for Trump above.
A few more words on 538 and what’s next…
Since the layoff last week, I have received a lot of emails offering to support the team in their next efforts, especially in getting data put back online. First, let me say thank you to everyone for their kind words and generosity. I firmly believe that data on public opinion should remain public, especially in this moment in politics, and I’m thrilled that so many people agree.
There is work being done behind the scenes to prepare editorial content and recreate various polling averages from scratch using what data is currently publicly available, but I want to take the planning time and do this right this time. The intent is eventually either to create a new media business that safeguards polling aggregation through subscriber support and monetized data streams, or to start a non-profit to ensure aggregation continues ad infinitum for the benefit of the public. The current assessment is that either one of these paths is possible, it’s just a matter of determining priorities, market demand, and deciding how big we want to go. If you represent an institutional or capital interest, don’t hesitate to reach out to me via email.
For my readers, however, the best thing you can do is to signal your interest in a future paid business. The most direct way to do that is to pledge a paid subscription to this newsletter. This does not cost anything! Pledging is a functionality Substack offers to people who have not yet turned on paid subscriptions in order to gauge how much revenue they could raise if they were to go public. As far as I can tell, you do have to enter your credit card information, but you will not be charged. I intend only to use the estimated revenue from pledges to this newsletter in our planning, which will likely involve a newsletter at a separate site. If that changes, and I do end up blogging here for money, you will hear about it before I activate anything.
Thanks for reading. The news about 538 sucks, and it’s not right for ABC to take everything offline. But I’m happy to be able to write to you all again, and I’m optimistic about the future.


I'm very disappointed about the status of 538. It's awful for you and everyone who worked there. A lot of the data collection, polling averages, modeling that 538 did, was very important and worth doing.
I have missed our regular chats and while we never met in person, I do think we are like acquaintances.
I wish you the best,
Elliot (spelled with two Ls and one T.)
The loss of 538 is awful. I'm hopeful that you and the other great data journalists can rebuild something from the ashes. Count me in as a supporter!