


Democrats are winning special elections like it's 2018
But does this reflect a change in voter preferences, or a change in who is voting?

Note: First time here? While this is my personal blog, a team of like-minded news nerds are actively trying to figure out how to scale up an independent polling and political data journalism business to rival our previous work at ABC News/FiveThirtyEight and other outlets. If you like empirical political journalism, you can signal your support for our work, at no cost to you, here.
The 2026 midterm election cycle is starting off similar to 2018, with signs of mass mobilization and electoral overperformance strongly favoring the Democrats. Republican Congresspeople, for example, have faced so much resistance at town hall meetings of their constituents that many of them have skipped appearances, and Vermont Senator Bernie Sanders and Democratic Congresswoman Alexandria Ocasio-Cortez have been drawing crowds of 30,000+ on their “Fighting Oligarchy” rally tour of America.
Then, there is the news from last night: A Democratic candidate won the special election in Pennsylvania’s 36th State Senate District, a seat where residents voted for Donald Trump over Kamala Harris by 15 points in 2024. And it’s not like PA SD-36 just recently moved right; in 2020, it voted for Trump over Biden by 17 points. It’s a red, red seat. And now, it’s a red, red seat represented by a Democrat.
At this point, you may be forgiven for feeling some déjà vu. This all feels eerily similar to the electoral shifts America felt during Trump’s first term, doesn’t it? Well, empirically it actually is. Thanks to the painstaking record-keeping of the team at The Downballot (formerly DailyKos Elections), we can compare Democratic overperformance in special elections in 2025 to those in 2017. And here’s the Downballot recap from PA SD-36:

I. Swings in special elections look a lot like 2018
For the 2026 election cycle so far, there have been 14 contested special elections in state house districts across the country. Using this spreadsheet of results and benchmarks, we can see that the Democratic candidates across those 14 seats beat Harris’s margin vs Trump with the same voters last November by 10 percentage points on average. That is, in the average state legislative district that has held a special so far in 2025, Harris beat Trump by 15 points in 2024. But in the special election for that average seat, the Democrat beat the Republican candidate by 25 points.
The biggest swings (24-25 points) have been in two Iowa House and Senate districts, while two seats in blue states (Delaware and Connecticut) actually moved toward Republicans by a couple points. In 12 of the 14 elections, Democratic candidates beat Harris’s margin. Here’s the full list of specials for 2025:
Now, thanks to The Downballot’s data archives, we can compare the average swing in special elections in 2025 to the average swing in specials held in 2017. There were 67 state legislative special elections held in 2017 for the 2018 midterm cycle, according to their tracking. In those, Democratic candidates beat Hillary Clinton’s margin vs Trump in 2016 by 11 points. So, an 11-point swing for Democrats in 2017, and 10 points for 2025 so far. Ten is not so different from 11.
But of course, we are only just nearly in April of 2025. What were the specials looking like at this point in 2017? Well there were a lot fewer contests at this point in 2017, but in the nine that were held Democrats did 9 points better than their benchmark. Nine is also not so different from 10.
II. The reason for the swing
Now, let’s talk causes and consequences. This is where we get to be a bit nerdy.
For consequences, the big thing is that although Democratic overperformance in 2017-2018 translated to a large swing in the House of Representatives popular vote in 2018, the same thing did not happen in 2024. In special elections held in 2023 and 2024, according to The Downballot’s data, Democrats did 3 to 4 points better in special elections than Joe Biden did against Trump in 2020, in the same boundaries.
If you assume that translated directly into a swing among the broader electorate, the special elections would have predicted Harris to beat Trump by 8-9 points in the 2024 presidential election. Of course, the swing went the other way: Trump beat his 2020 margin in the national popular vote for president by about 6 percentage points. This means you cannot assume that overperformance in special elections necessarily translates to overperformance in general elections (wouldn’t that just be too easy?).
So what gives? What’s going on here is that the electorate that’s voting in special elections is not the same as the electorate voting in general elections. By definition, the general electorate is full of voters who are much less engaged than those that also turn out for specials. There is an engagement bias in the group of people who turn out for specials that makes them not a 1:1 predictor for swings in generals.
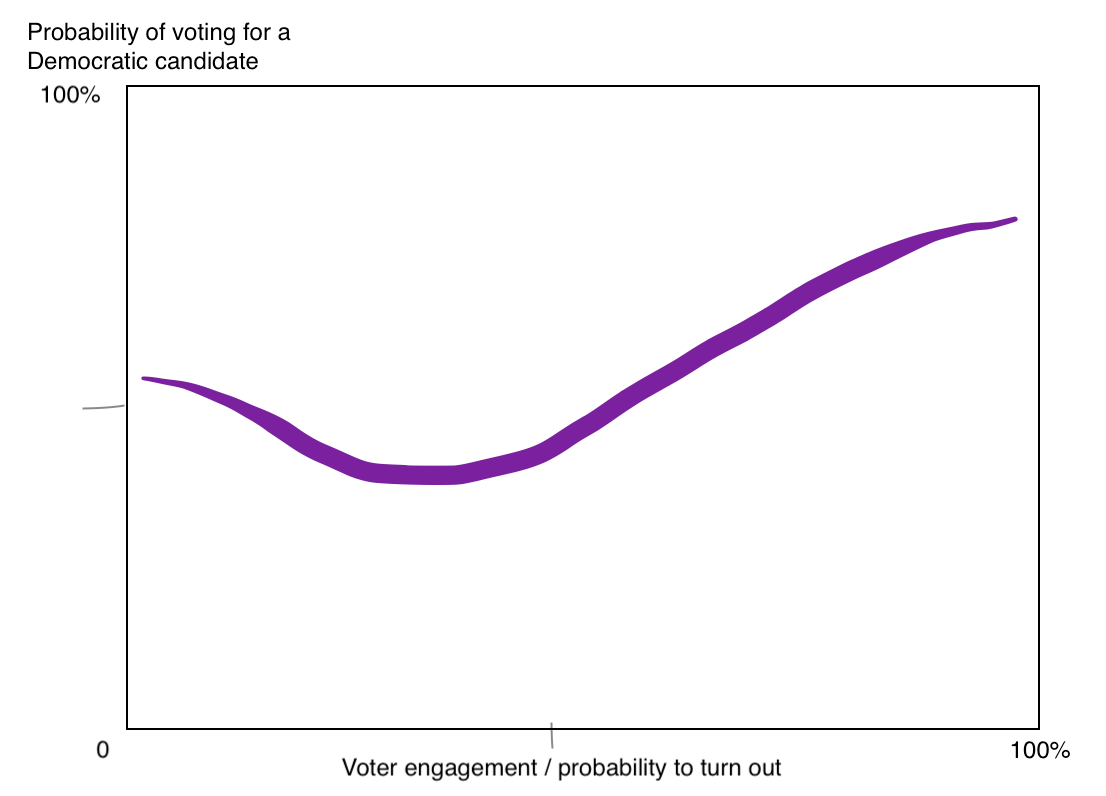
Let’s see if I can convey this with a chart. Below, I have drawn the (hypothetical) relationship between how engaged a voter is and how likely they are to vote for a Democratic candidate. Assume that this line captures the relationship between every registered voter in the country, all ~190m of them.1 Note that the line moves up and to the right, showing that the more engaged someone is, the more likely they are to vote Democratic. I have based this curve on the math from Nate Cohn and the NYT/Siena poll team.
Now you can start to imagine how Democrats will do if certain segments of the electorate turn out. If only the most engaged voters turn out, Democrats would do very well. If, instead, the voters in the middle of the graph show up, Republicans would win soundly. We can visualize this by adding a line to the chart that shows where people actually turn out. In a world where 75% of registered voters cast ballots, the chart looks like this, with a line at 0.25 (since 1-0.25 = 0.75).
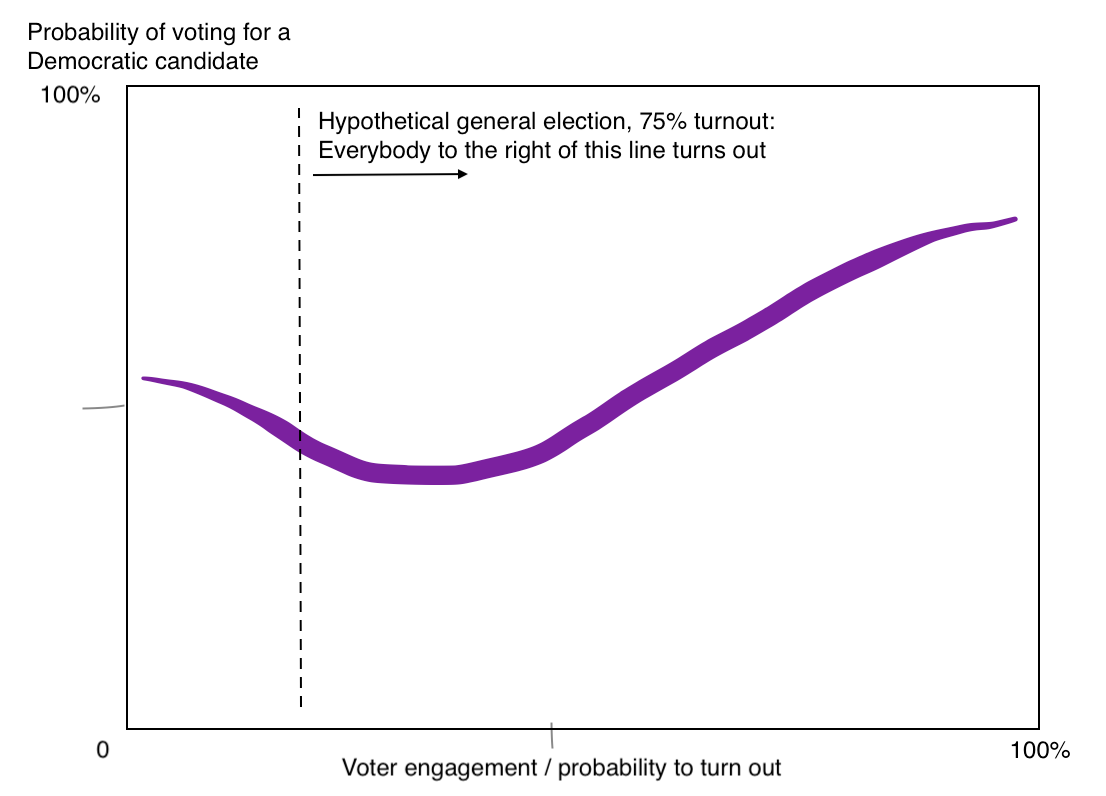
In this world (a hypothetical general election), Republicans win because of the density of voters in the low-engagement-but-still-vote category. This is what happened in 2024.
Now, let’s draw an election where only the most engaged people turn out:
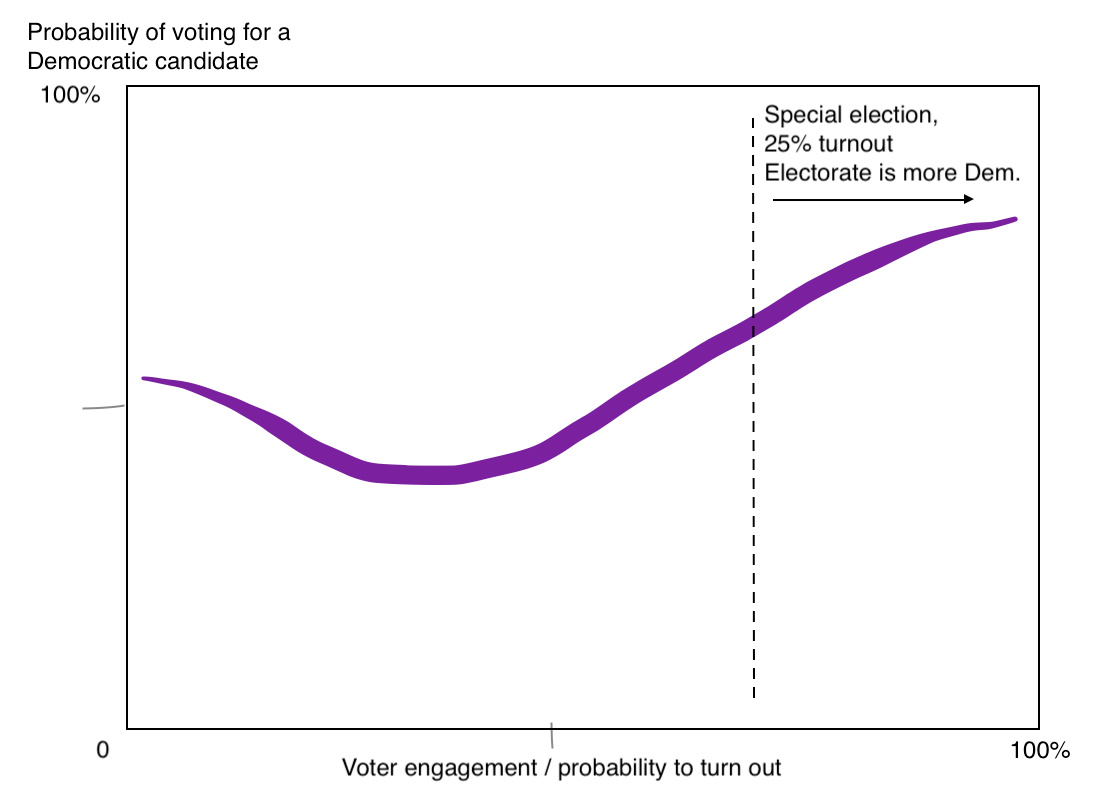
Here, you can see that in a very low-turnout election where only the top 25% likeliest voters turn out, Democrats do exceptionally well. This is your special elections. In the PA SD-36 special on March 26, just 50,000 people turned out. That is half the number of voters in the 2022 election, and probably close to 25% of the 2024 general election number.
This means that if you re-ran the 2025 special elections among the same group of people that turned out in 2024, you would see a much smaller swing. Or, it’s possible that similar to 2024, you might see no swing at all, or a negative swing. Since we do not observe the votes of every likely voter in each district, is impossible to know if people are actually changing their votes, or if (like the voter file data suggests) the people turning out to vote are just different people.
Of course, the real world is not so binary. Don’t get the impression that changes in election results are driven only 100% either by turnout or changing preferences. Usually it’s some combination of both. Based on similar analyses of the 2024 election, my prior is that this year’s specials reflect maybe ~80% change in turnout, and ~20% change in voter preferences. (If I had voter file data, I could be sure of the exact split.)
III. Population trends favor Democrats in 2026
Still, one simple fact remains: If Democrats are doing better with higher turnout voters, given the increasingly sharp relationships between (1) education and turnout and (2) education and voting Democratic, the party should basically necessarily expect to do well in the 2026 midterms. That’s because midterms are lower turnout elections than presidential general elections — the question is whether the midterm electorate is closer to the electorate turning out in 2025 specials or in the 2024 general. One other consideration is that Democrats also have the edge with high-income voters, who are likelier to turn out than the average voter.
Given these dueling electorates, we can foresee a trend where political power in the U.S. oscillates left and right as partisans show up for and tune out of elections. Trump showed that he can overperform when voters with a lower turnout probability actually show up to the polls. That may not be true forever, but so long as it is, the rest of the time, Democrats will be doing better.
The upshot of all of this is that, thanks to education polarization, we will inevitably end up with a funny mix of legislators elected in on- and off-years, representing different people with sharply different partisan political preferences simply by virtue of different contests having different turnout rates. This means, yes, special elections are less predictive of outcomes than before — but that does not mean they are useless or that we should ignore them.
I could do the actual math here if someone gave me $10,000 for access to a voter file, but that’s an egregious expense in my opinion for what we can generally posit based on supporting observational evidence and logic.)
Great piece. One observation: In 2022, PA-SD-36 was uncontested. The GOP incumbent got 92K votes. Interestingly, when it was last contested in 2018 (under slightly different lines), total turnout was not a *lot* higher—105K.
50K is low in comparison of course but seems high to me for a special!
I wonder if candidate quality has to do with all of these