Polling and Political Data Hub
This page contains interactive graphics and data downloads for Strength In Numbers’ political data trackers, including averages of Trump’s approval by the issues, state-level Trump approval, an index of U.S. economic growth according to indicators that have historically predicted election results, and a forecast of the electoral environment based on polling and economic data. We are constantly adding new data features based on recommendations from subscribers, so feel free to get in touch with any ideas!
New! Check out the new dashboard for our monthly Strength In Numbers/Verasight poll. Premium subscribers get access to additional trend charts and full crosstabs.
Note: Some polling averages have moved! Strength In Numbers’ topline polling averages are now published at FiftyPlusOne.news. To view interactive charts and download polling data via our exclusive API, readers should check out our new website.
Polling Averages
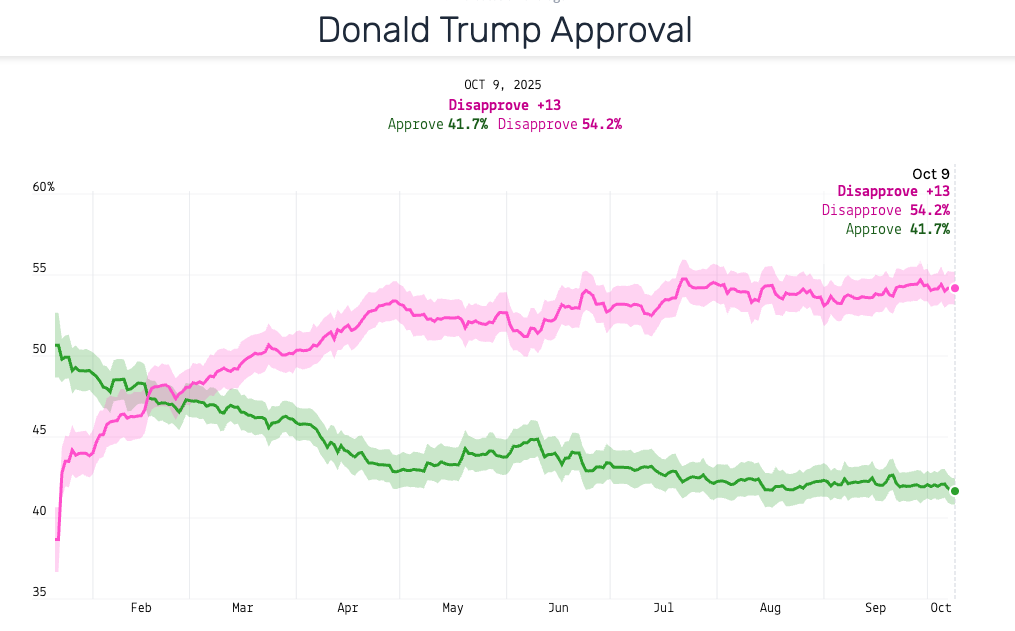
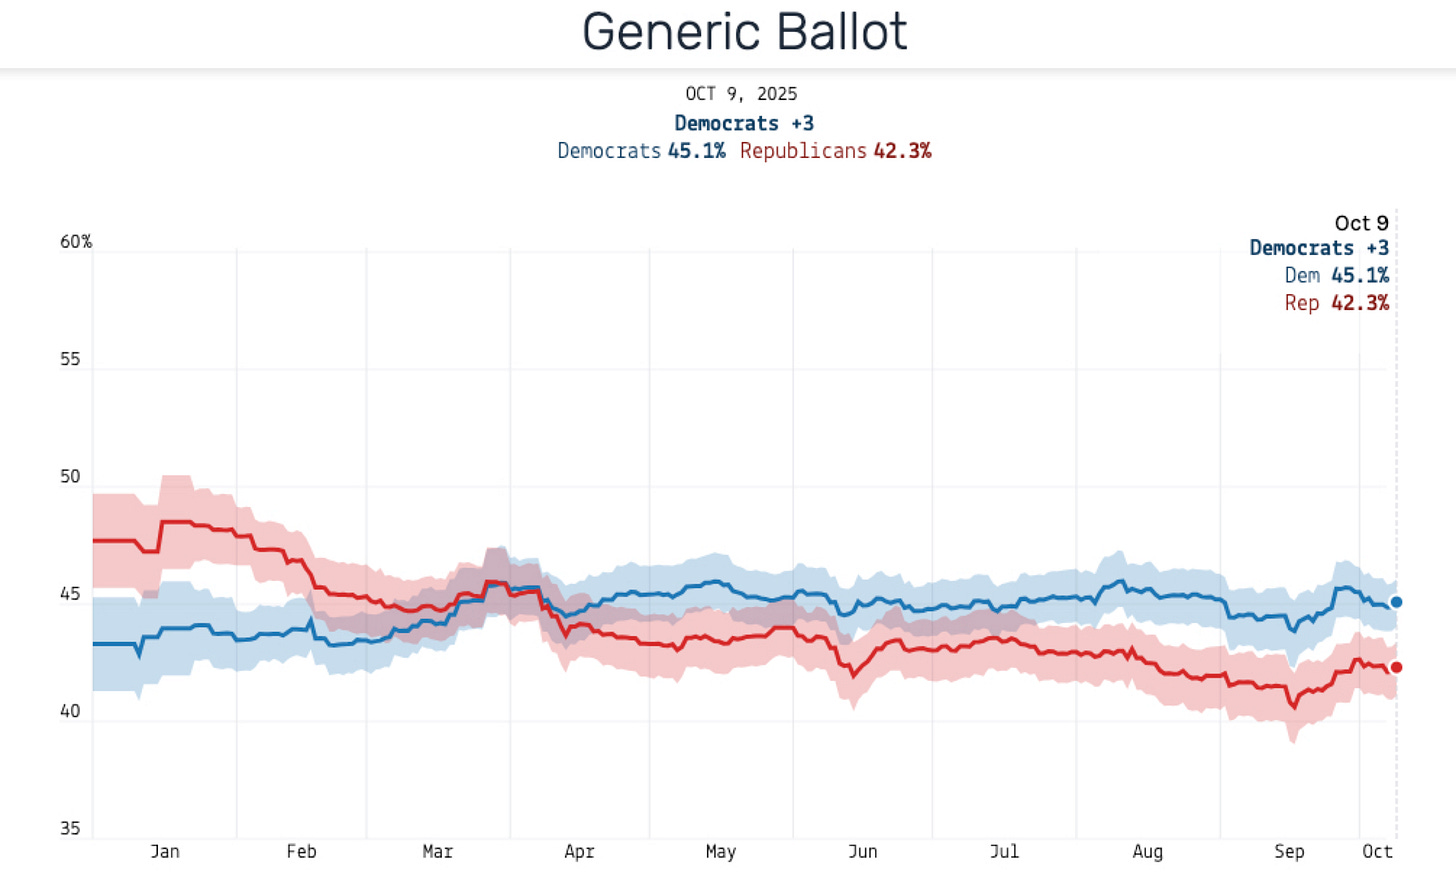
Strength In Numbers’ polling averages are now published at FiftyPlusOne.news! The screenshots below will not update frequently.
Generic Ballot Average
Other trackers
Some of these charts will make their way over to our new website over time. They are updated below until that happens.
Trump’s approval rating by issue
This chart shows Trump’s net approval rating (approve % minus disapprove %), per the chart above, alongside his approval rating for handling specific issues:
Trump’s net approval rating by state
This is what Trump’s net approval rating would be in every state if you shifted the results of the 2024 election toward/away from the president based on the change from his 2024 national popular vote margin to his current net approval rating.
How Does Trump Compare to Other Presidents?
Here’s Trump compared to recent presidents in their first term:
This is what the chart above looks like if you compare Trump to other presidents in their second terms:
And Trump versus every president since 1953:
Support independent political analysis
It takes time and computational infrastructure to gather and analyze this data. Please consider becoming a paid member to Strength In Numbers to support more work like this, and receive additional exclusive data and political analysis from an independent, data-driven perspective:
Cost of Ruling Index
Check back later…
Economic Index
A daily updating average of politically salient economic indicators.
This chart shows economic growth according to a model of 16 different economic variables, ranging from unemployment and manufacturing output to trade exports and government spending. The variables have been selected based on their individual correlation to historical election outcomes, as well as their effect on the ability of the resulting index to predict change in political support. The methodology and code for this model is publicly available here. On this chart, 0 represents average growth, and the scale captures the standard deviation above/below average. A value of 1 in either direction roughly translates into an annual GDP change of +/- 8 percent.
Note: The estimates in this chart will update daily, but you will see the most recent data point presented as an estimate for the whole week.
This estimate is generated using a model similar to the now-casts from the New York and Atlanta Fed banks, with the added wrinkle that we are not asking “What is GDP growth today, according to all the latest data I have?” it’s “What is GDP growth today if we reconstructed GDP using the variables that best predict presidential outcomes?” I also use fewer high-frequency variables and all indicators are scaled to measure annual change, rather than month-on-month or quarterly change.
In other words, this index is optimized to predict both annual GDP growth, so it is interpretable by economists and journalists, and election outcomes, so we can write about political implications knowing the thing we are looking at has historically had an impact on politics. You can see how well this index predicts these outcomes on GitHub.
Check back soon for a list of recent releases and their impact on the index.


