


Welcome to Strength In Numbers!
Strength In Numbers is a data-driven news website covering U.S. politics, elections, and public opinion. The mission here is simple: to help you be smarter about politics and the news using empirical analysis based on hard data — not speculation, conventional wisdom, or “vibes.”
This Substack is written by me, G. Elliott Morris, a data-driven journalist and author of the book Strength In Numbers based in Washington, DC. Previously, I was a Senior Data Journalist at The Economist and the Editorial Director of Data Analytics for ABC News, where I oversaw FiveThirtyEight’s coverage and data aggregation/election-forecasting operation. Now I’m independent, with no institutional constraints or corporate overlords — just following the data wherever it leads.
Readers to Strength In Numbers can expect to get polling analysis, frequently-updating data trackers, and transparent data-driven commentary on American politics. I also field original monthly surveys (for which premium subscribers are welcome to submit potential questions).
If you want politics coverage that shows its work and teaches you how to interpret the numbers yourself, you’re in the right place.
What you get
Strength In Numbers has two main subscription tiers: Free and Paid. If you pay, you get more content, more data (poll crosstabs and modeled estimates), access to community features (comments and a private chat server), and more.
Here’s what lands in your inbox, depending on your subscription level:
Everyone gets:
Friday: Chart of the Week: Quick, visual-first analysis of interesting polling or political data
Sunday: The weekly Data Roundup: What happened this week in politics and what the numbers say about it
Monthly: Poll toplines and a write-up article for my original Strength In Numbers/Verasight national surveys, plus crosstabs where they are mentioned in the write-up
Occasional one-off posts where breaking news or notable data warrant it
Premium subscribers also get:
Tuesday: A premium Deep Dive: long-form analysis on public opinion, polling, elections, methodology, or what the data actually shows on a notable topic
Monthly: Full poll crosstabs and deeper dives into the Strength In Numbers/Verasight surveys, not just toplines
Regularly: Additional data-driven pieces and commentary (I publish these at will, usually for premium readers)
Election nights: Special live coverage with real-time modeling, forecasts, and analysis when it matters most
Discord access: Join a growing private community for discussion and direct engagement
Anytime: Full access to the website archive (most posts here at SIN are auto-paywalled after 6 months).
To see what a premium subscription looks like in action, browse the archive.
Pricing: A premium subscription is $10/month or $90/year. I think this is a reasonable price, given the frequency, quality, and uniqueness of output here. Frankly, nowhere else in media are you going to find this coverage of data in politics and elections that is so comprehensive, deep, original, and innovative. As a benchmark, generally, Strength In Numbers is far cheaper than competitor data-driven sites that offer less hard data and fewer articles (some political intelligence websites are $350 a year!).
Substack also offers a higher subscription tier they call founding members, who can pay whatever they want, above a certain value, to get additional perks and support the infrastructure costs that make SIN possible (polling, data trackers, computational resources). I call this subscription tier Strength In Numbers PRO:
PRO members get:
Early access to new trackers and data from our public polling
Founders-only Discord to directly message Elliott and a team of like-minded, data-driven polling and political professionals
Support the infrastructure that makes public posts and polls possible
Extra gratitude from Elliott for making this publication a reality
A few other notes: The monthly poll will typically be released on the third Tuesday of each month, but can move around depending on news needs other data needs. On poll weeks, the Tuesday Deep Drive is often replaced with monthly poll results. Other than pressing news analysis, I try to send all newsletters in the morning — usually at 7:32 a.m. Eastern.
If you believe in the power of data (ahem, the strength in numbers), please support our growing community with a paying subscription:
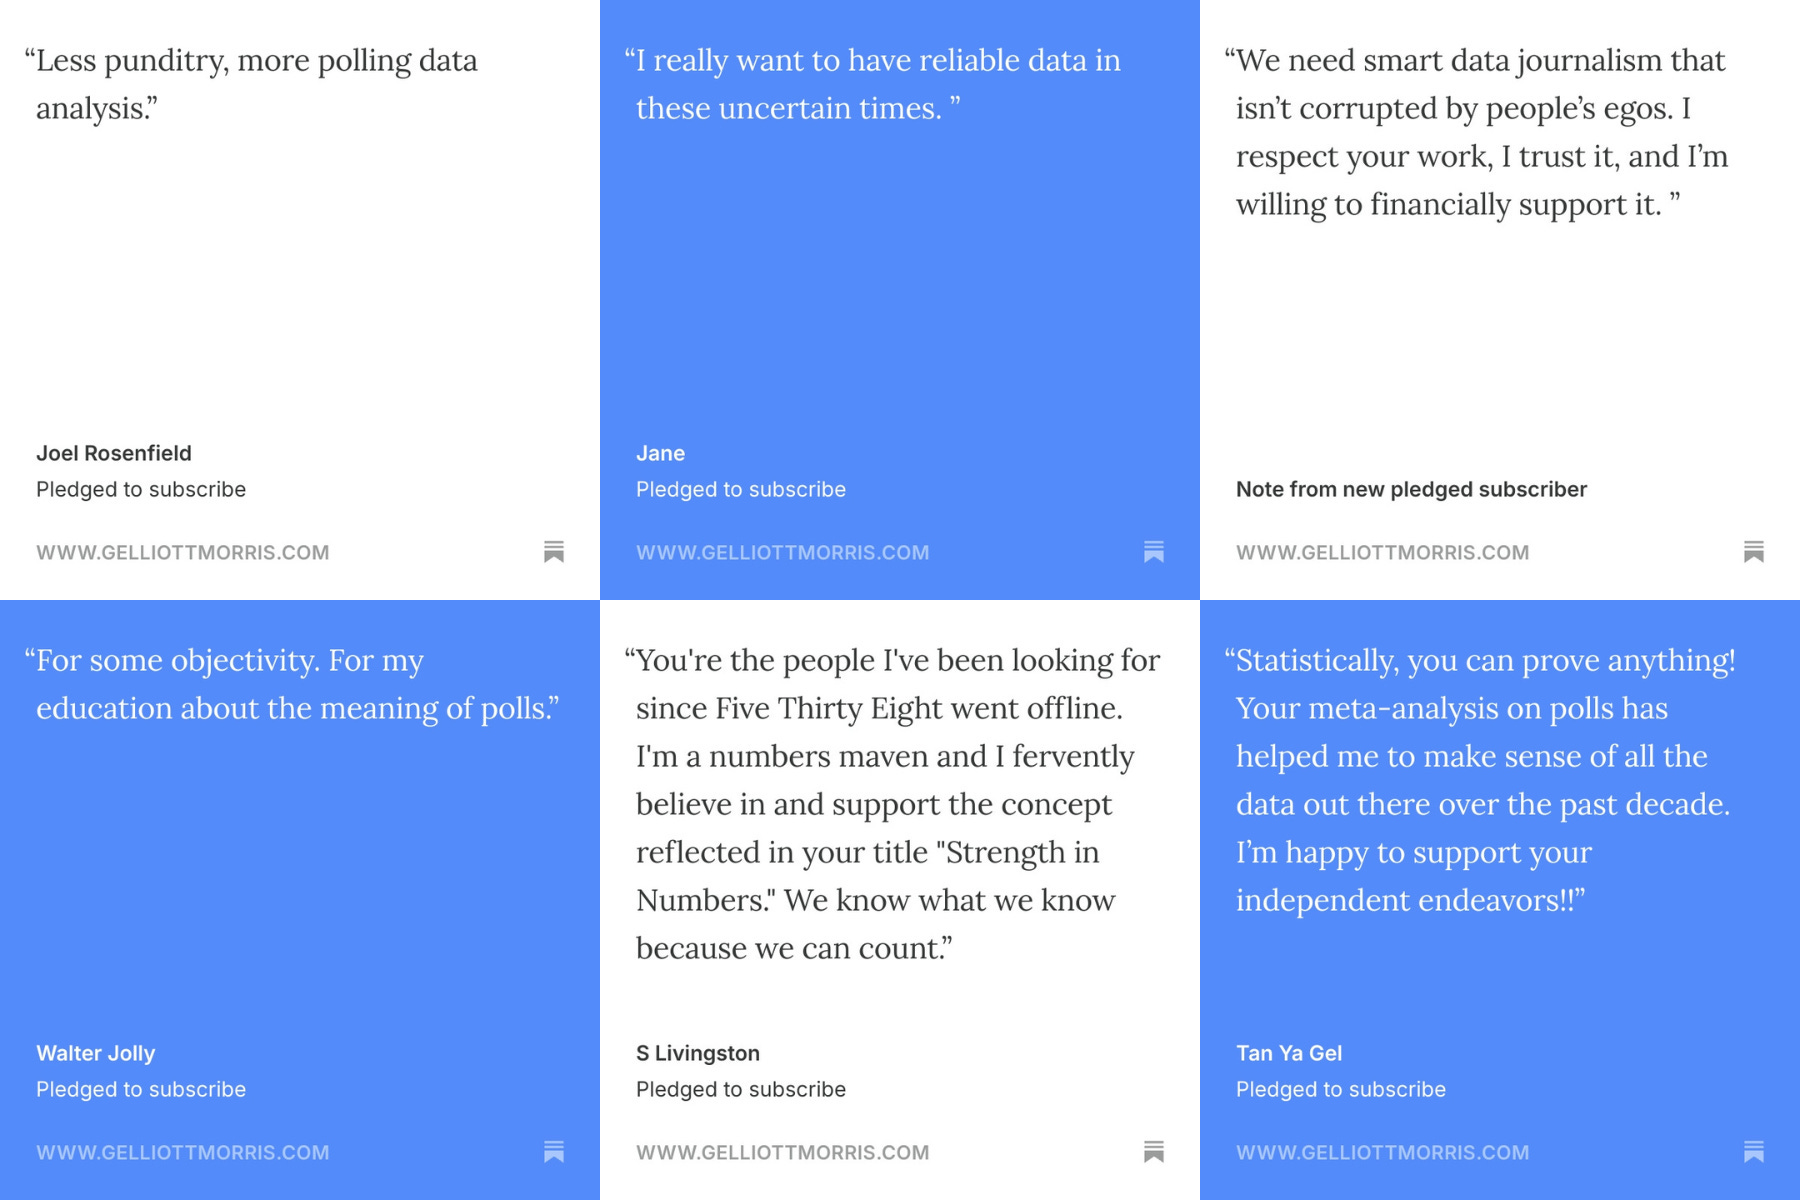
Here are a few quotes from some nice people who said nice things about Strength In Numbers:
My work
Strength In Numbers published evidence-based analysis of politics, economics, and the news. The bread and butter of my work is “news analysis” pieces that explore nuanced topics within politics and political psychology using statistical models and data visualization. I dive into the crosstabs myself, boot up the academic data, and come to objective conclusions about the issues animating political discourse today.
My approach is pretty much to let the data speak for itself. I don’t do hot takes and I don’t do breathless commentary. I aggregate data, build models, and explain what the numbers tell us about the world — and, just as importantly, what they don’t.
In practice, most of my work can fall into one of these buckets:
General analysis of politics & public opinion: For example, in 2025, I’ve tracked Donald Trump’s approval rating on the issues and analyzed what Americans actually thought about his policies. Other work has included why Americans didn’t support his policy agenda despite his electoral victory, why voters blamed him for economic problems, and how Trump lost his advantage on inflation and immigration.
Political strategy & upcoming election handicapping: I’ve analyzed what the data shows about party coalitions and messaging strategy, with particular focus on the 2026 midterms. I’ve written about why Democrats were winning special elections like it’s 2018, how much politicians should care about polls vs leading opinion, why Democrats should fight back on immigration instead of retreating, and the Latino shift to Republicans and its drivers.
Data trackers: I maintain frequently-updating dashboards at gelliottmorris.com/data tracking Trump’s approval rating, generic ballot polling, presidential favorability, and other key political indicators. These trackers provide real-time snapshots of American public opinion.
Electoral reform & structural politics: I’ve written about how America’s political institutions shape outcomes — and how they could work better. I’ve analyzed the price we pay for minority rule, the end of majority rule in America, why newer Congressional maps are fairer but not as fair as claimed, multiparty democracy and ranked-choice voting, and how the 2022 midterms revealed gerrymandering’s effects.
Polling (actual polling, not commentary on polling): Every month, our bespoke national poll in partnership with Verasight includes a set of core tracking questions and questions submitted by subscribers. The data from the poll has been used in stories about public opinion on everything from inflation to trade policy to immigration to institutional trust. I’ve also used innovative methodologies like state-level opinion estimates and new techniques for coding open-ended survey responses with AI to understand how voters think beyond traditional left-right ideology.
Deep dives on polling methodology: I’ve taught readers how to interpret polls and evaluate pollster quality. I’ve published how to read the polls like a nerd, why you should mostly ignore partisan pollsters, how to read outlier polls, how to tell when poll movement reflects real opinion change, and why the (good) pollsters got the 2022 midterms right.
I’m not here to tell you what to think. I’m here to show you what the data shows, explain how we know it, and help you make sense of politics with evidence instead of speculation. This is not conventional political coverage. Most outlets chase narratives, quote unnamed sources, and traffic in endless speculation. I show my work. I explain uncertainty. I teach you how the sausage gets made so you can evaluate it yourself.
To be clear, data-driven doesn’t mean free of values. I think democracy is good, polling transparency matters, and electoral reforms like ranked-choice voting and proportional representation would strengthen our political system. But my analysis follows the evidence, not my preferences. If the data contradicts my priors, I say so.
Join a community for data-driven journalism
If you’re someone who cares about understanding politics and public opinion deeply and objectively — without the noise of traditional news coverage, the biases of punditry, and algorithmic pollution of social media — this community is for you. If you’d like to sign up for a free subscription, or already have and want to become a paid member, click this button:
If you are not interested in all the frills of a paid subscription, or you would simply like to make a one-time contribution directly to the Strength In Numbers business account, you can send a donation via Stripe using the button below. Donations are used to support operating costs, like salaries and servers:
And if none of these options are right for you financially, the best thing you can do is post about this publication and share this article with your friends and family!
Refund policy
In the rare occasion a subscriber is not happy with a paid monthly membership, I am happy to offer them a prorated refund for the time remaining in the month. Unfortunately, for revenue planning reasons, the business cannot accommodate refund requests for yearly membership made 8 days or after the first payment, so if you’re uncertain about the yearly commitment, it’s best to start on the monthly trial and update if you like the content and community. Refund requests can be sent via email to contact@gelliottmorris.com.
About me
I’m a professional statistician, data scientist, and political journalist, and was also trained as a political scientist and pollster. I specialize in data-driven analysis of elections, polling, and public opinion.
I am also an author. In 2022 I wrote the book Strength in Numbers: How Polls Work and Why We Need Them, a comprehensive exploration of public opinion polling and its vital role in democracy. The book delves into the history, methodology, and impact of polls, advocating for their continued relevance in capturing the public’s voice. I also do a good amount of speaking to public and private clients, and there’s a good chance you’ve come across some of my slides on polling and forecasting too.
Before going independent, I spent years leading data-driven analysis at The Economist and directing data analytics at ABC News (including FiveThirtyEight’s coverage and forecasts). I studied Government, History, and Computer Science at the University of Texas at Austin, and I’m now based in Washington, D.C.
Why do this work? Because democracy depends on good information. When polls are done right—and interpreted carefully—they’re powerful tools for understanding what people actually think. In an era of misinformation and vibes-based takes, that matters more than ever.
Guidelines
I like to think that over the last decade of writing, I have developed a pretty unique voice and value proposition for my political journalism. In general, I try to follow the principles/guidelines below:
I don’t guess. I aggregate data, build statistical models, and analyze results. When the data is uncertain or contradictory, I explain why. When I don’t know something, I say so.
Uncertainty is part of the deal. Polls aren’t perfect. Models can miss. Forecasts are probabilistic, not deterministic. I’m upfront about all of this. It’s the only way to do this honestly.
Work should be maximally transparent. People see how analysts reach their conclusions. I uphold this standard by releasing as much data and methodological detail about my work as possible. Data sources, weighting decisions, model assumptions — it’s all documented. If I made a mistake, I’ll correct it publicly.
My work is meant to teach, not just report. What’s a margin of error? Why do different polls show different results? How should you interpret a favorability rating? You’ll learn the answers here — not because I want to show off, but because informed readers make better citizens.
If you want to understand politics instead of just reacting to it — if you’re tired of pundits with no data and analysts with no transparency — this newsletter is for you.
Subscribe
Join 50,000 readers getting smarter about politics every week.
Free subscribers get Friday’s Chart of the Week, Sunday’s Data Roundup, and monthly poll toplines.
Premium subscribers get all that plus Tuesday Deep Dives, full polling crosstabs, election-night coverage, bonus analysis, and Discord access.
Questions? Get in touch
“In God we trust. All others must bring data.” —W. Edwards Deming
